
5. Monitoring: making impact visible
Monitoring means documenting progress and impact so that an initiative can learn, communicate and make political arguments. It does not need to be complicated – and it doesn’t have to be left to experts. Self-initiated research has its own validity: it shows decision-makers where to look and lets them see a street through a different lens.
Connect data and storytelling.
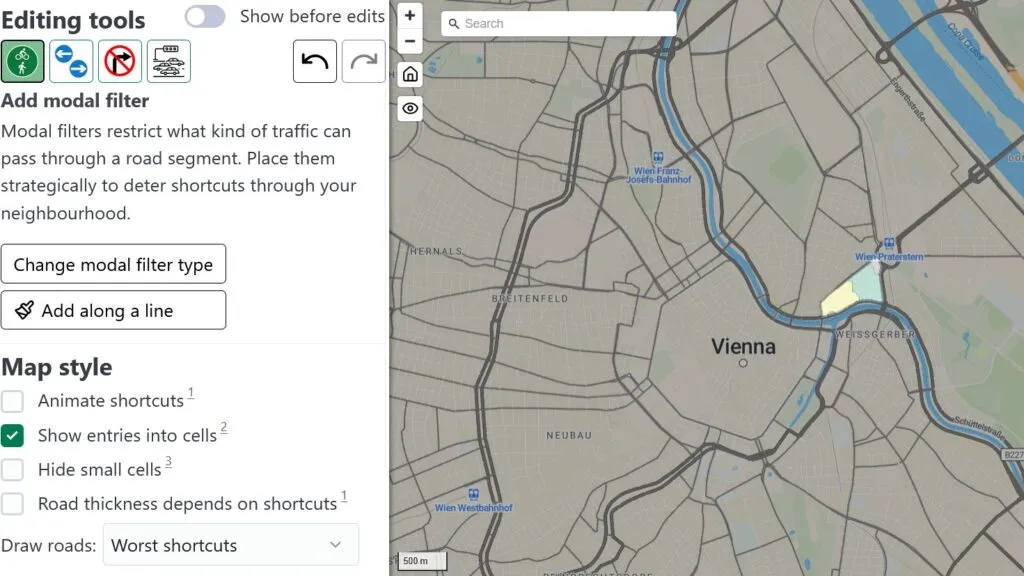
The LTN tool helps test traffic filters and diversions in a neighbourhood scenario. Source: A/B Street LTN Tool.
Four ways to collect data
Prostorož in Ljubljana combines different methods depending on the question – and on the people it wants to reach.
1. Surveying
2. Mapping
3. Collective mind maps
4. Combining physical and digital
Observing life on the street
Counting and observing show what actually happens in a street – not just what people say.
What can be measured
Simple indicators work well for superblocks, tactical urbanism and street design:
- Traffic volumes: How many cars, bicycles and pedestrians use a section?
- Speed and conflicts: Where do people drive too fast, and where do dangerous situations arise?
- Use for spending time: Do people stop or sit down, do children play, do conversations emerge?
- Parking: Which spaces are actually used, and when?
- Climate and comfort: Is there shade, urban heat, greenery, drinking water or noise reduction?
- Support: How many people sign, attend meetings, share content or offer help?
- Political progress: What motions, discussions, commitments or administrative reviews are taking place?
| Indicator | Simple method | Good result format |
|---|---|---|
| Through traffic | Count at two fixed time windows | Figure, photo, map |
| Pedestrian flows | Counts in 15-minute intervals, incl. direction | Flow map |
| Quality of stay | On-site observation, mapping where people stay | Short notes, quotes, map |
| Parking | Occupancy counts at different times | Occupancy chart |
| Heat and comfort | Hot spot mapping, shade map, photo points | Heat map, before-and-after photo pair |
| Support | Conversations, signatures, meetings | List with roles and contacts |
From data to change
Data alone rarely convinces anyone. Prostorož’s approach combines three steps: activating, envisioning and patiently waiting. In one action, kayak stands, a red fabric roof and a few folding chairs turned five parking spaces into a place to stay. Paint can rezone a street for a day. And visualisations that respond directly to what the research revealed make the case far better than a table of numbers.
Four lessons from Ljubljana
- Connect data and storytelling. Numbers become powerful when they are part of a story people recognise.
- Combine physical interventions with long-term visions. A temporary action shows what is possible; the vision explains where it leads.
- Steal from the “bad side”. Use the tools of marketing: strong images, simple messages, good timing.
- Take a lot of photos. You will need them – for reports, social media, press and political talks.
A minimal monitoring plan
- Document the baseline: photos, a map, a short problem note and an initial count.
- Define a target: for example, less through traffic, more safe crossings or more supporters.
- Choose a method: survey, mapping, traffic or pedestrian count, observation, street radar or before-and-after photos.
- Pick the right moment: heat on hot days, traffic at rush hour, play after school.
- Assign responsibilities: one person coordinates data, one photos, and one quotes and contacts.
- Present results: One page is often enough – problem, method, key figures, photos and demand.
- Learn: What needs adjusting in your demand, action or alliance-building?
Monitoring as mobilisation
Monitoring can itself be an action. A street traffic count gets people talking. Test benches with a feedback form invite passers-by to have their say. A map of hot or dangerous spots can attract new supporters – and every person who joins a count is a potential new active ally.
Tools from the series
- Surveys and hot spot mapping following the Prostorož approach
- Pedestrian flow counts and parking occupancy observations
- Public Life app for observing life on the street
- Traffic counts following the Changing Cities approach
- Conversation guides for businesses and local actors
- Leiwander Straßen Radar for quick on-site assessment
- Superblock base map and LTN tool for spatial scenarios
- Before-and-after documentation for tactical urbanism actions